应用场景
硬件/整机信息:ARM平台
OS版本信息:服务器e版
软件信息:nload 0.7.4版本
功能概述
在日常运维过程中需要实时监控或统计终端网络流量使用情况的场景中,可使用此相关工具进行实时监测网络的入口和出口流量。
功能介绍
nload是一款命令行下的网络流量监测工具,可以实时监测网络的入口和出口流量,支持图形化和文本化显示网络流量信息。
安装使用
本文将以ARM架构服务器e版系统中安装工具过程作为举例进行详细介绍~
一:资源下载
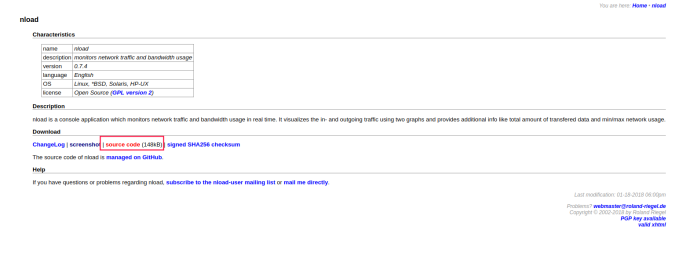
请从nload项目主页中下载相关版本的源码包,本篇将以0.7.4版本为例进行编译安装说明:
项目官网下载链接:http://www.roland-riegel.de/nload/
二:安装工具
1、解压缩相关源码包:
root@uos-PC:~# tar -zxvf nload-0.7.4.tar.gz2、安装依赖软件:
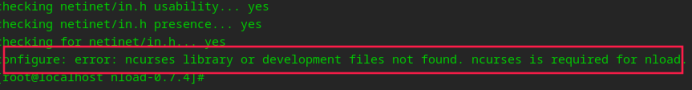
root@uos-PC:~# yum install ncurses*注意:这里如果没有安装相关依赖软件,在下面的编译配置步骤中可能会遇到对应的依赖缺失报错,所以建议先安装完毕所依赖的软件:
3、编译配置
root@uos-PC:# cd nload-0.7.4
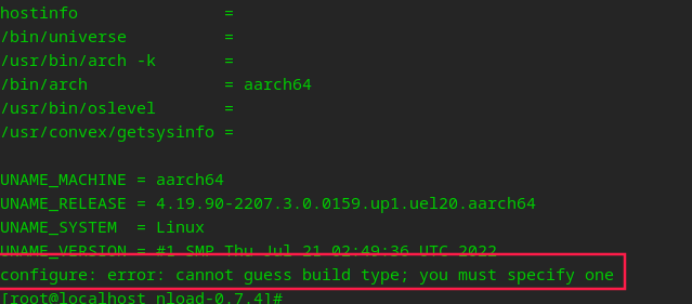
root@uos-PC:nload-0.7.4# ./configure --build=arm-linux
注意:实测AMD架构编译配置时无需手动指定架构参数信息;ARM架构环境需要指定架构信息参数,即其中的“--build=arm-linux”参数,否则会遇到下列的报错:
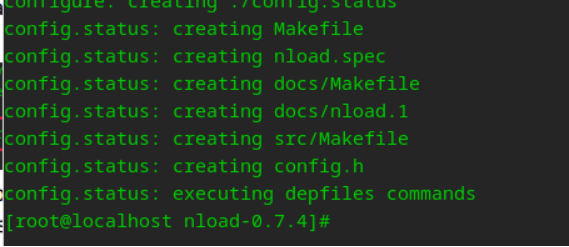
编译配置成功后,会有如下的反馈信息:
4、编译安装
执行下面的指令进行编译安装:
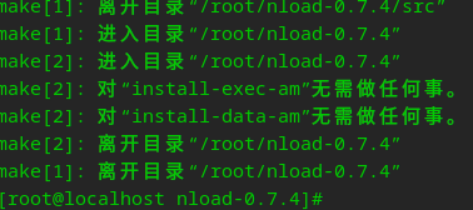
root@uos-PC:nload-0.7.4# make && make install成功编译安装完毕,会有类似如下的提示反馈:
三:工具用法
nload <options> <devices>说明:
直接输入nload即可启动此工具,将统计当前网卡设备的实时流量情况;
1、 执行
nload指令即可启动工具,启动后会自动对当前网卡设备进行实时流量统计:
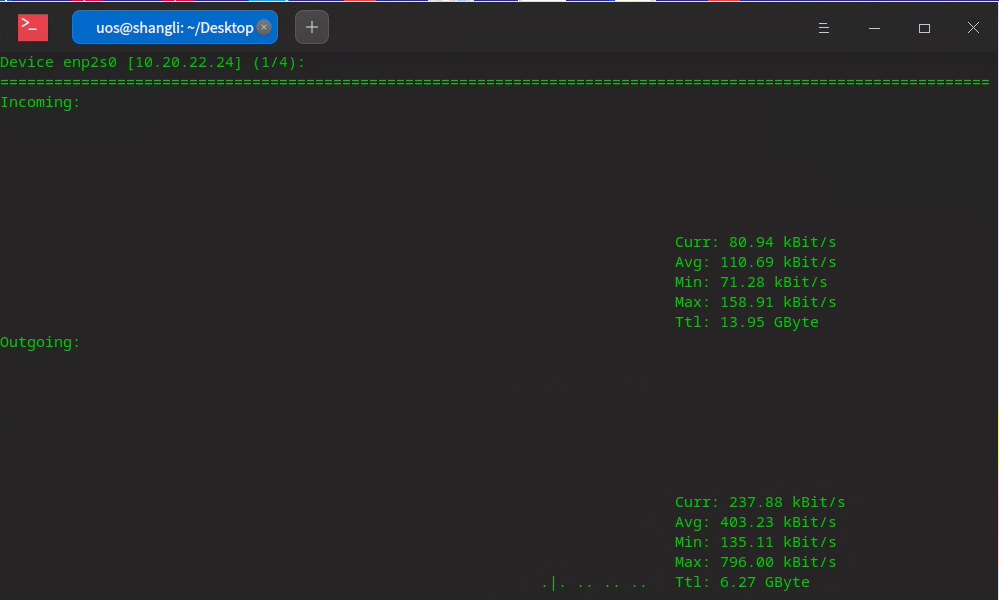
如上图所示,会直接显示当前系统内的网卡Device设备的实时流量情况,举例图片中的系统环境中存在4个网卡设备,本页面显示的是enp2s0网卡的入口和出口流量。
流量参数简介如下:
| 参数 | 描述 |
| Curr | 当前流量 |
| Avg | 平均流量 |
| Min | 最小流量 |
| Max | 最大流量 |
| Ttl | 总和流量 |
2、查看帮助说明
nload -h可直接通过-h参数查看工具帮助信息:uos@uos-PC:~$ nload -h
nload version 0.7.4
Copyright (C) 2001 - 2012 by Roland Riegel <feedback@roland-riegel.de>
nload comes with ABSOLUTELY NO WARRANTY. This is free software, and you are
welcome to redistribute it under certain conditions. For more details see the
GNU General Public License Version 2 (http://www.gnu.org/copyleft/gpl.html).
Command line syntax:
nload [options] [devices]
nload --help|-h
Options:
-a period Sets the length in seconds of the time window for average
calculation.
Default is 300.
-i max_scaling Specifies the 100% mark in kBit/s of the graph indicating the
incoming bandwidth usage. Ignored if max_scaling is 0 or the
switch -m is given.
Default is 10240.
-m Show multiple devices at a time; no traffic graphs.
-o max_scaling Same as -i but for the graph indicating the outgoing bandwidth
usage.
Default is 10240.
-t interval Determines the refresh interval of the display in milliseconds.
Default is 500.
-u h|b|k|m|g Sets the type of unit used for the display of traffic numbers.
H|B|K|M|G h: auto, b: Bit/s, k: kBit/s, m: MBit/s etc.
H: auto, B: Byte/s, K: kByte/s, M: MByte/s etc.
Default is h.
-U h|b|k|m|g Same as -u, but for a total amount of data (without "/s").
H|B|K|M|G Default is H.
devices Network devices to use.
Default is to use all auto-detected devices.
--help
-h Print this help.
example: nload -t 200 -i 1024 -o 128 -U M
The options above can also be changed at run time by pressing the 'F2' key.
常用参数简介:
-a:全部数据的刷新时间周期,单位是秒,默认是300。
-i :进入网卡的流量图的显示比例最大值设置,默认10240 kBit/s。
-o:出去网卡的流量图的显示比例最大值设置,默认10240kBit/s。
-m:不显示流量图,只显示统计数据。
-t:显示数据的刷新时间间隔,单位是毫秒,默认500。
-u :设置右边Curr、Avg、Min、Max的数据单位,默认是实时变化的,注意大小写单位不同!
-U :设置右边Ttl的数据单位,默认是实时变化的,注意大小写单位不同(与-u相同)!
Devices:自定义监控的网卡,默认是全部监控的,使用左右键切换。
键盘左键 :返回上一个网卡Device展示页。
键盘右键 :前往下一个网卡Device展示页。
3、应用举例
查看全部网卡设备的流量监控(不显示流量图示):
nload -m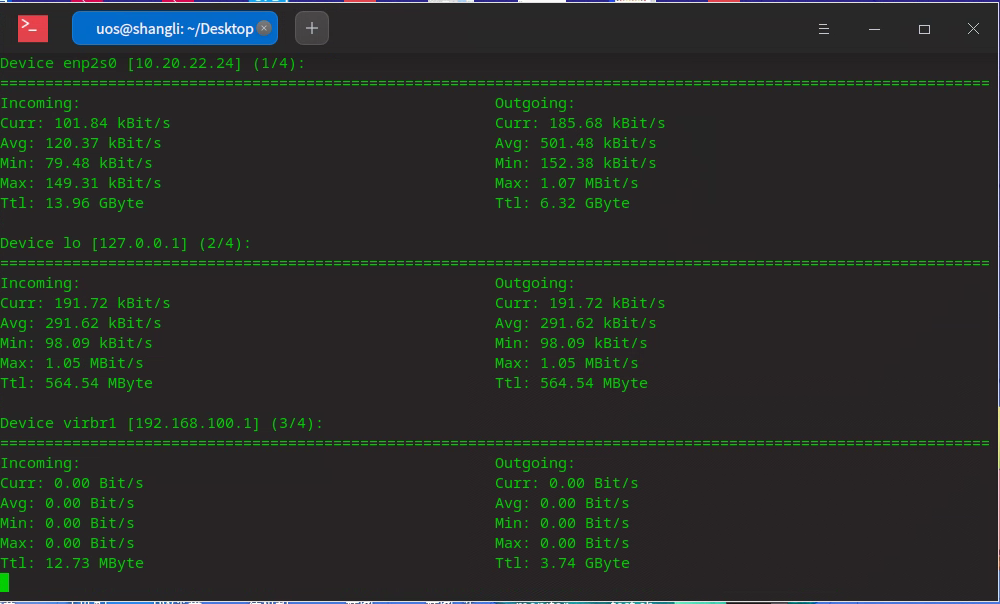
显示单块网卡(enp2s0)每秒的流量情况:
nload enp2s0 -m -u H -t 1000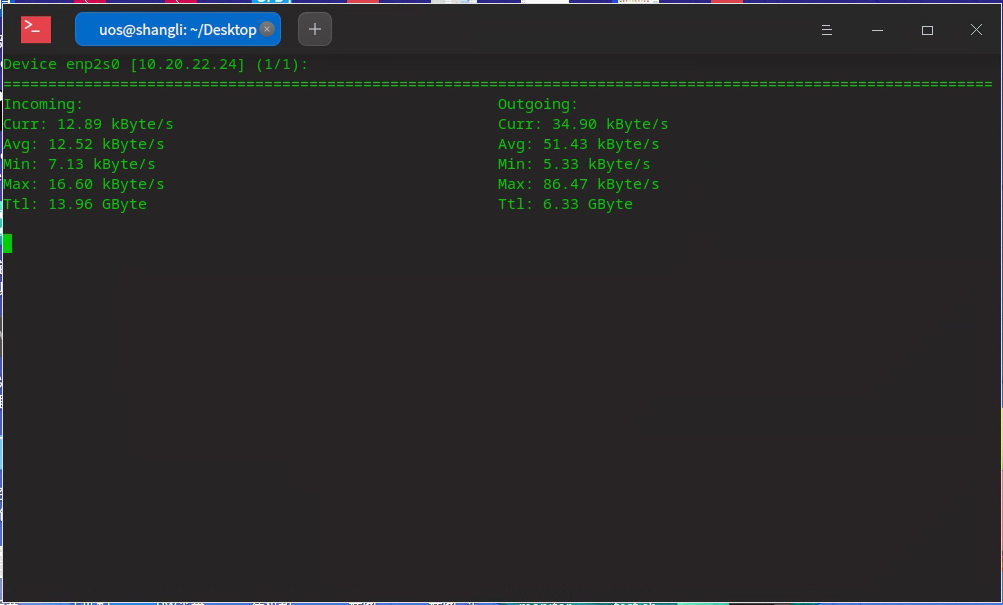
©统信软件技术有限公司。访问者可将本网站提供的内容或服务用于个人学习、研究或欣赏,以及其他非商业性或非盈利性用途,但同时应遵守著作权法及其他相关法律的规定,不得侵犯本网站及相关权利人的合法权利。除此以外,将本网站任何内容或服务进行转载,须备注:该文档出自【faq.uniontech.com】统信软件知识分享平台。否则统信软件将追究相关版权责任。